How to Measure Climate Change: The Science Behind Tracking Our Planet’s Temperature
Scientists track global temperature changes through a network of more than 10,000 weather stations positioned across every continent and ocean. These stations record daily highs and lows, creating datasets that now span over 150 years. When you see headlines about record-breaking temperatures, they’re pulling from this vast monitoring system that compares today’s readings against historical averages.
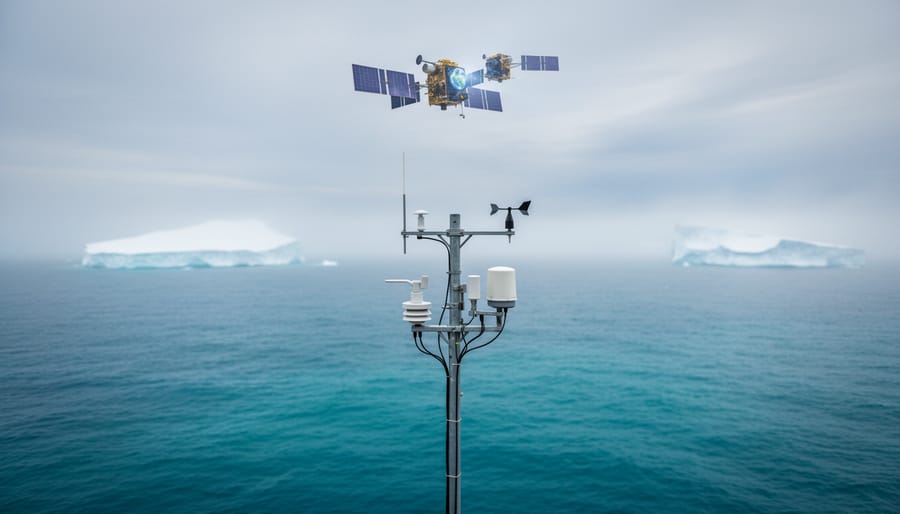
Satellites orbiting Earth measure climate shifts from space, capturing everything from ice sheet thickness in Greenland to sea surface temperatures in the Pacific. NASA and NOAA operate dozens of these satellites, which scan atmospheric carbon dioxide levels, monitor vegetation patterns, and track extreme weather events in real time. This bird’s-eye perspective reveals changes impossible to see from ground level alone.
Ice cores drilled from Antarctica and Greenland preserve atmospheric samples dating back 800,000 years. By analyzing tiny air bubbles trapped in these frozen time capsules, researchers reconstruct past CO2 concentrations and temperatures with remarkable precision. These ancient records prove that current greenhouse gas levels exceed anything our planet has experienced in hundreds of millennia.
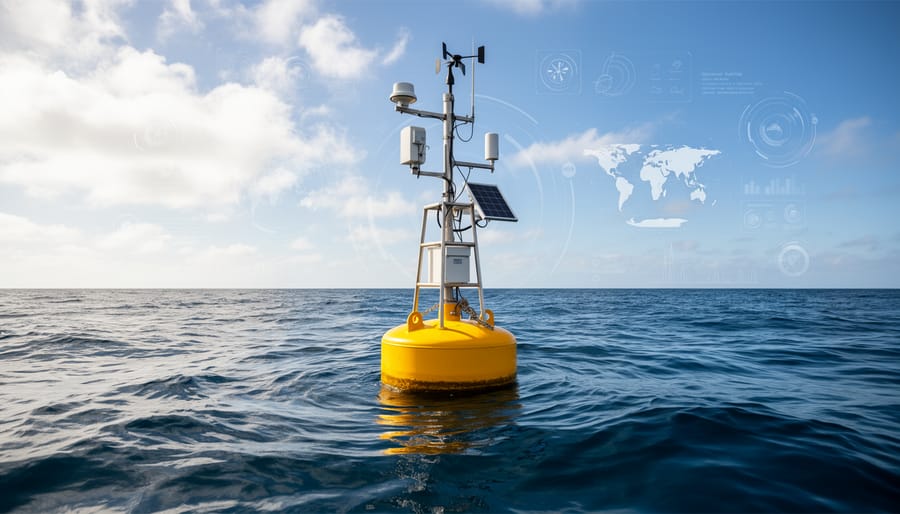
Ocean buoys and research vessels measure sea temperature, acidity, and salinity across all major water bodies. Since oceans absorb about 90% of excess heat from global warming, tracking these changes matters enormously. The data shows ocean temperatures have risen consistently since 1970, with corresponding increases in acidity that threaten marine ecosystems.
Here in Pennsylvania, climate scientists at Penn State and the University of Pittsburgh contribute to national measurement efforts, studying everything from changing precipitation patterns to shifting agricultural zones. Their work helps translate global trends into local impacts you can observe in your own community.
Understanding these measurement techniques transforms abstract climate data into tangible reality. The science isn’t guesswork or prediction. It’s careful observation, repeated verification, and decades of consistent evidence pointing in the same direction.
The Key Climate Indicators We Track
Scientists track our changing climate through six core measurements that tell the story of Earth’s transformation. Each indicator reveals a different piece of the puzzle, and together they form a comprehensive picture of how our planet is responding to increased greenhouse gases.
Global temperature averages form the foundation of climate measurement. Research stations across every continent and ocean record daily temperatures, which scientists compile into worldwide averages. When we hear that 2026 marks one of the warmest years on record, that conclusion comes from millions of individual temperature readings processed through rigorous quality checks and statistical methods.
Atmospheric carbon dioxide concentration provides the most direct measure of human impact on our climate system. Scientists measure CO2 in parts per million, tracking how fossil fuel combustion and deforestation push this heat-trapping gas to levels not seen for hundreds of thousands of years. The measurements show a clear upward trend that correlates directly with rising temperatures.
- Global temperature averages track heat changes across land and ocean surfaces worldwide
- Atmospheric CO2 concentrations measure the primary greenhouse gas driving climate change
- Sea level rise records ocean expansion and ice melt through coastal gauges and satellites
- Ocean acidity monitors pH changes as seawater absorbs excess carbon dioxide
- Ice mass measurements track the shrinking of glaciers, ice sheets, and Arctic sea ice
- Extreme weather patterns document the frequency and intensity of storms, droughts, and heat waves
Sea level measurements combine data from thousands of tide gauges with satellite altimetry to track ocean rise. Coastal communities particularly feel this change, as even small increases compound flooding during storms and high tides.
Ocean acidity might sound like a chemistry concern, but it directly threatens marine ecosystems. As oceans absorb roughly a quarter of the CO2 we emit, the water becomes more acidic, measured through pH monitoring stations worldwide. This shift stresses coral reefs and disrupts the food chains that billions of people depend on for protein.
Ice mass tracking uses everything from ground-based surveys to gravity-measuring satellites. Scientists monitor the Greenland and Antarctic ice sheets, mountain glaciers, and seasonal Arctic sea ice. The consistent trend shows ice melting faster than natural cycles would predict.
Extreme weather tracking has become increasingly sophisticated, allowing scientists to identify patterns in hurricanes, floods, droughts, and heat waves. While no single storm proves climate change, the statistical analysis of these events over decades reveals clear shifts toward more intense and frequent extremes.
These measurements work together like instruments in an orchestra, each contributing essential information that helps us understand the full scope of planetary change.
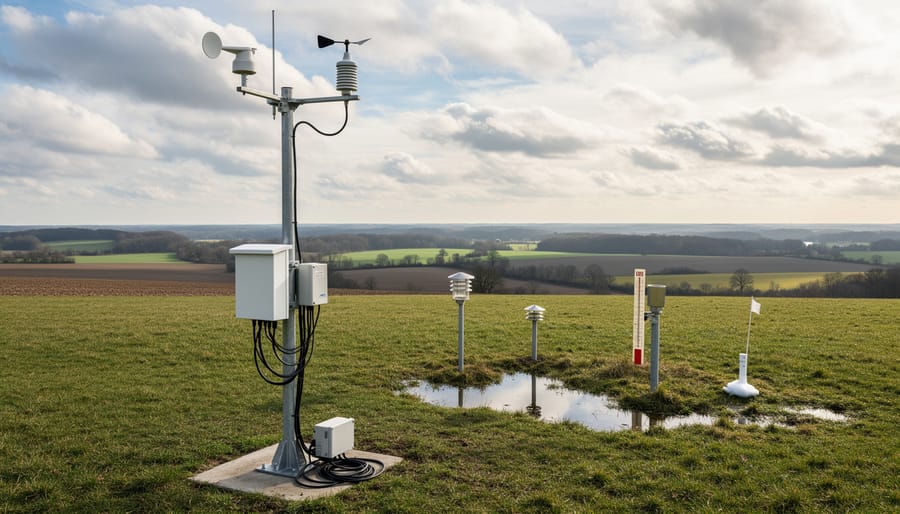
Ground-Level Measurement: Weather Stations and Surface Monitoring
Weather stations scattered across your community and around the world form the backbone of climate measurement, collecting round-the-clock data that scientists use to identify long-term patterns. These ground-based instruments measure temperature, rainfall, humidity, wind speed, and atmospheric pressure at thousands of locations, creating a detailed picture of how local conditions contribute to global climate trends.
The network includes permanent weather stations operated by government agencies, automated instruments at airports and research facilities, and ocean buoys floating in remote waters. Each station records measurements at regular intervals throughout the day, year after year. This continuous operation is crucial because climate science relies on decades of consistent data from the same locations to distinguish meaningful trends from normal weather variation.
Ocean buoys deserve special attention in climate measurement. Floating instruments anchored across the world’s seas track sea surface temperatures, ocean currents, and salinity levels that influence weather patterns and store massive amounts of heat. The oceans absorb roughly 90 percent of the excess heat trapped by greenhouse gases, making these measurements essential for understanding the full scope of climate change.
Ground-level monitoring captures details satellites cannot see. A weather station records exact precipitation amounts, measures air quality at breathing level, and detects subtle temperature changes in specific microclimates. When combined with data from neighboring stations, these local readings reveal regional patterns like shifting growing seasons, changing precipitation totals, and the frequency of extreme heat days.
The real power emerges when thousands of monitoring sites share their data. Scientists compile measurements from this global network to calculate planetary averages, identify temperature anomalies, and track how quickly conditions are changing. Your local weather station is not just forecasting tomorrow’s conditions; it is contributing to the historical record that helps us measure climate change with precision.
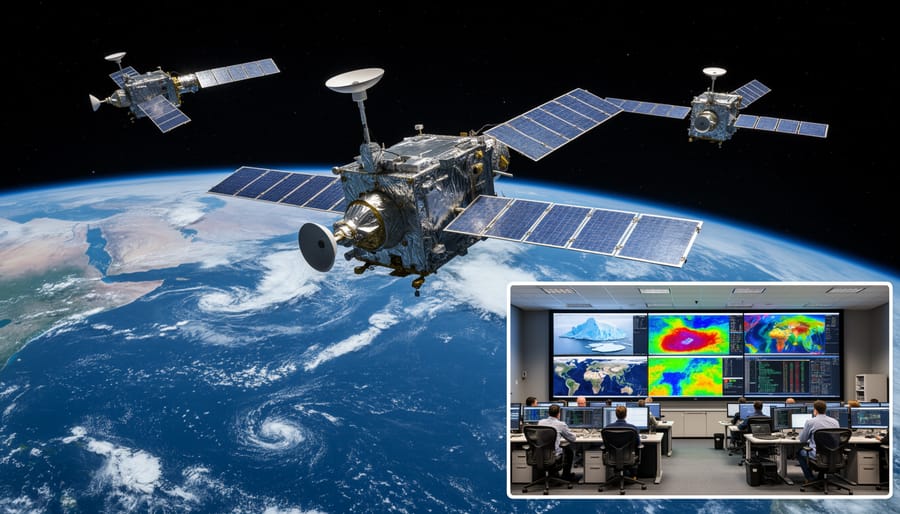
Eyes in the Sky: Satellite Technology
Satellites orbit far above weather systems and political boundaries, giving scientists a continuous view of the entire planet that ground stations simply cannot match. While a weather station measures conditions at one spot and ocean buoys track specific water parcels, satellites sweep across continents and oceans every few hours, collecting data from regions so remote that no human will ever install a thermometer there.
NASA and international space agencies deploy specialized instruments that measure far more than just temperature. Radar altimeters bounce signals off ice sheets in Greenland and Antarctica to track thickness changes down to centimeters, revealing annual ice loss that contributes to rising seas. Infrared sensors scan ocean surfaces to map temperature variations that drive weather patterns like El Niño. Spectrometers analyze sunlight passing through the atmosphere, quantifying CO2, methane, and water vapor concentrations across different altitudes and latitudes.
This bird’s-eye perspective fills critical gaps. The Arctic and Antarctic hold vast ice masses that profoundly affect global climate, yet harsh conditions make continuous ground monitoring nearly impossible. Satellites measure these polar regions year-round, tracking summer melt and winter accumulation. They also monitor sea ice extent, providing daily snapshots of how much ocean freezes each winter and thaws each summer.
Remote sensing excels at capturing large-scale patterns. A satellite image reveals deforestation across entire river basins in hours, whereas ground surveys might take years. Scientists combine data from multiple satellites to build comprehensive pictures of how Earth’s systems interact. They cross-check satellite measurements against ground stations to ensure accuracy, using both tools together to understand climate change with precision impossible from either method alone.
Looking Back: Ice Cores and Historical Climate Data
Understanding climate patterns from centuries or even millennia ago requires detective work on a planetary scale. Scientists rely on natural archives that preserve chemical and physical traces of past atmospheric conditions. Ice cores drilled from Greenland and Antarctica contain tiny air bubbles trapped when snow compacted into ice, offering direct samples of ancient atmospheres stretching back 800,000 years. By analyzing the ratio of oxygen isotopes in these cores, researchers reconstruct temperature fluctuations with remarkable precision, distinguishing natural cycles from the sharp warming spike following industrialization.
Tree rings provide annual climate records for regions with distinct growing seasons. The width and density of each ring reflect temperature and moisture conditions during that year, creating a timeline that, in some cases, extends back thousands of years. Sediment layers from lake beds and ocean floors capture pollen grains, microorganisms, and chemical signatures that reveal ecosystem changes linked to climate shifts. Coral skeletons work similarly, recording seasonal growth bands influenced by sea surface temperatures and ocean chemistry.
These natural records are indispensable for establishing baseline variability. Without them, scientists couldn’t separate the warming driven by greenhouse gas emissions from fluctuations Earth has experienced naturally. The data show that current warming is happening roughly ten times faster than ice-age recovery warming and correlates directly with industrial emissions rather than solar cycles or volcanic activity.
This historical perspective also reveals how sensitive ecosystems are to temperature changes. Past shifts of just a few degrees triggered species migrations, ocean circulation changes, and sea level adjustments, with arctic temperature impacts being particularly pronounced. That context makes today’s rapid warming all the more concerning and underscores why accurate measurement of both past and present climate is essential for projecting our environmental future.
Tracking Greenhouse Gases: National and International Inventories
Countries track their greenhouse gas contributions through structured national inventories that measure emissions across all sectors of the economy. These inventories count carbon dioxide, methane, nitrous oxide, and other heat-trapping gases released from transportation, industry, agriculture, energy production, and waste management. The measurement process combines direct monitoring from facilities, statistical models based on activity data (like fuel consumption or livestock populations), and standardized calculation methods that allow fair comparisons between nations.
As a signatory to the United Nations Framework Convention on Climate Change, Canada prepares and submits an annual national greenhouse gas inventory to the UNFCCC. This yearly reporting requirement creates a continuous measurement timeline that tracks whether emissions are rising, falling, or holding steady. The same framework applies to nearly 200 countries worldwide, creating the largest coordinated measurement effort in environmental history.
These standardized inventories matter because international climate agreements depend on verifiable data. When countries commit to emission reduction targets, these annual reports provide the evidence that measures progress. The measurements reveal which sectors are improving and which need stronger action. For instance, if a nation’s energy sector emissions drop after installing more solar in Pennsylvania and similar renewable projects nationwide, the inventory captures that trend with specific numbers.
The reporting framework uses consistent methodologies developed by the Intergovernmental Panel on Climate Change, which means an emission from a factory in Toronto gets measured the same way as one from a plant in Berlin. This standardization transforms individual national measurements into a global picture of greenhouse gas concentrations. Without these coordinated inventories, we would lack the foundation for meaningful international climate action or the ability to measure whether our collective efforts are working.
Pennsylvania’s Climate Measurement Efforts
Pennsylvania plays a vital role in climate measurement through a coordinated network of state agencies, academic institutions, and local environmental groups working to track changing conditions across the Commonwealth’s diverse ecosystems. The Pennsylvania Department of Environmental Protection operates multiple monitoring stations that collect real-time data on air quality, precipitation patterns, and temperature fluctuations from the Pocono Mountains to the Delaware River watershed. These ground-based measurements feed into larger regional climate models, helping scientists understand how rising temperatures affect everything from maple syrup production in the state’s forests to agricultural growing seasons in Lancaster County.
Universities across Pennsylvania contribute specialized research that advances measurement techniques. Penn State’s Earth and Environmental Systems Institute develops sophisticated computer models that analyze climate data collected from satellites and ground stations, while Temple University’s Center for Sustainable Communities examines urban heat island effects in Philadelphia using thermal imaging and sensor networks. These academic efforts translate complex measurements into actionable insights for state policymakers and local communities.
Local environmental organizations amplify measurement efforts by engaging citizens in data collection. The Chesapeake Bay Foundation coordinates volunteer water quality monitoring programs where Pennsylvanians test stream temperatures and pollution levels, creating datasets that reveal how warming affects tributary ecosystems. Dr. Sarah Mitchell from the Clean Air Council explains that grassroots monitoring empowers residents to document environmental changes in their own neighborhoods, bridging the gap between professional climate science and everyday observation.
This multi-layered approach creates a comprehensive picture of how climate change manifests across Pennsylvania’s varied landscape, from increased flooding in Pittsburgh to shifting bird migration patterns observed by the Audubon Society. The combination of government infrastructure, university research, and community participation demonstrates how regional measurement systems support both local environmental action and the broader scientific understanding of climate trends.
How You Can Access and Understand Climate Data
You don’t need a PhD to explore climate data. Start with NASA’s Climate Change Vital Signs portal, which presents global temperature trends, CO2 levels, and ice sheet measurements through interactive charts anyone can understand. The National Oceanic and Atmospheric Administration (NOAA) offers Climate.gov, featuring maps and graphs that translate raw data into visual stories about changing precipitation patterns and warming oceans.
For deeper dives, NOAA’s National Centers for Environmental Information provides downloadable datasets on everything from local weather station records to sea surface temperatures. These databases let you examine specific regions or timeframes. Canada’s official greenhouse gas inventory, submitted annually to the United Nations Framework Convention on Climate Change, shows how countries track emissions systematically.
Learn to interpret the numbers. When you see “global temperature anomaly,” that means the difference from a long-term average, not absolute temperature. Rising CO2 concentrations measured in parts per million show accumulation over time. Many visualization tools include tutorials explaining these concepts, removing barriers that make climate science feel inaccessible.
Start locally. Pennsylvania’s climate data comes through state monitoring networks and university research centers you can access online. Compare historical temperature records for your county against current readings. Understanding how climate change affects us becomes clearer when you examine your own region’s trends.
Translate knowledge into choices. Once you grasp measurement systems showing warming patterns, you can make informed decisions, from supporting emissions reduction policies to implementing green home heating tips that reduce your carbon footprint. Climate data isn’t just numbers on screens. It’s the evidence base for building a more sustainable future.
Understanding how we measure climate change is the first step toward meaningful environmental action. The networks of weather stations, satellites, ice cores, and greenhouse gas inventories we’ve explored aren’t just scientific tools, they’re the foundation for every informed choice we make about our planet’s future. When you grasp how scientists track temperature shifts, monitor CO2 levels, and document sea level rise, you move from passive concern to active participation in climate solutions.
This knowledge empowers you to evaluate news critically, support evidence-based policies, and make daily decisions aligned with environmental reality. The measurement systems working around the clock, from Pennsylvania’s local monitoring programs to international data-sharing efforts, provide the clarity we need to address this challenge effectively. Stay curious about climate data. Explore the public databases available to you. Share what you learn with your community. Every person who understands the science behind climate measurement becomes part of the solution, transforming abstract statistics into personal motivation for sustainable living.